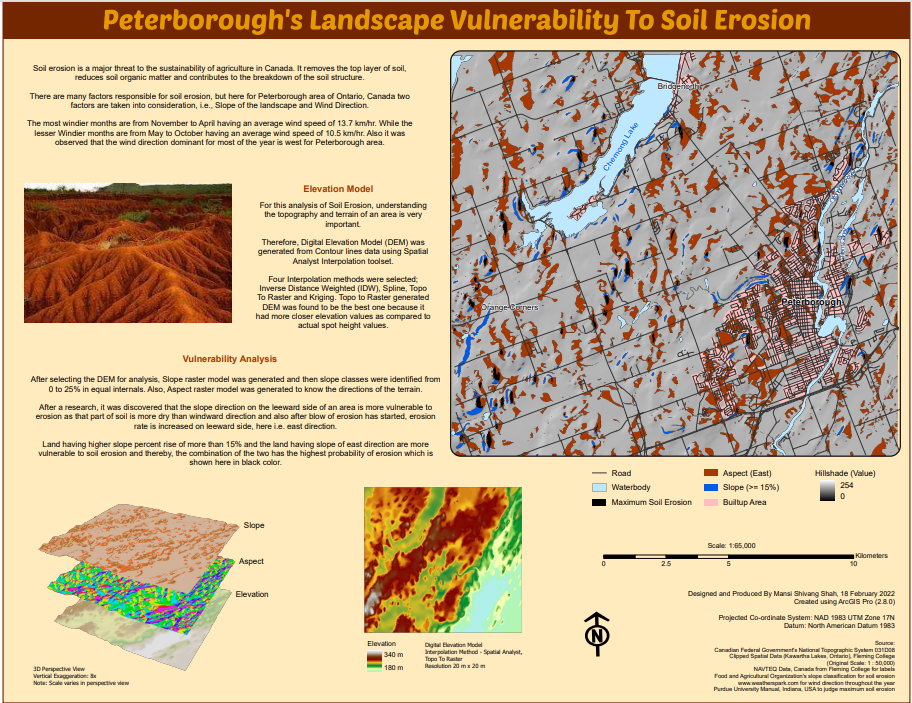
Interpolation with the Spatial Analyst Extension in ArcGIS Pro
The map layout below is showing the soil erosion vulnerability of the Peterborough area in Ontario , Canada. The core of this analysis is based on the Digital Elevation Model (DEM) that is used to prepare slope, aspect & hillshade layers in the map to predict soil erosion in the area. The DEM was generated from Contour lines data using Spatial Analyst Interpolation toolset. Four Interpolation methods were selected; Inverse Distance Weighted (IDW), Spline, Topo To Raster and Kriging. Topo to Raster generated DEM was found to be the best one because it had more closer elevation values as compared to actual spot height values. A detailed report of steps showing how interpolation and Spatial Analyst toolset in ArcGIS Pro has been used and how the best DEM model is derived.
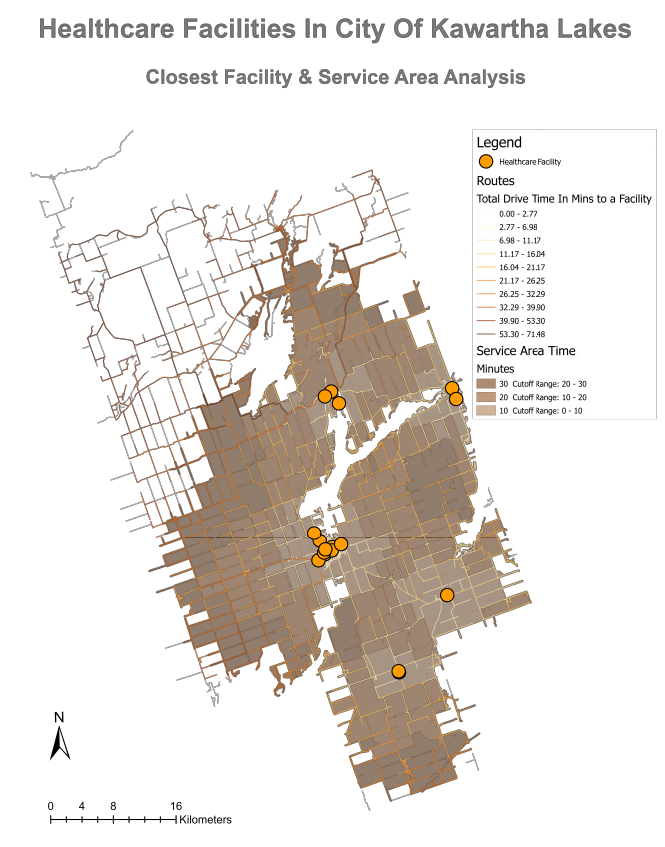
Closest Facility & Service Area Network Analysis
The map layout below is showing the reach of Healthcare facilities in Kawartha Lakes city of Canada. It is divided into two situations, one is how much time (in minutes) is required to reach a hospital or any healthcare facility (aka Closest Facility Analysis) and other situation is how much time is needed by an ambulance or any health emergency vehicle to reach out in any part of the city from the hospitals (aka Service Area Analysis). Various spatial analysis techniques like geocoding a series of spreadsheets, linear referencing, topology correction and Network analysis are used to achieve the results. Steps are mentioned above as a flowchart.